Food &
Beverage
- Fermented Beverages
- Animal-free food
- Artificial meat
- Animal feed
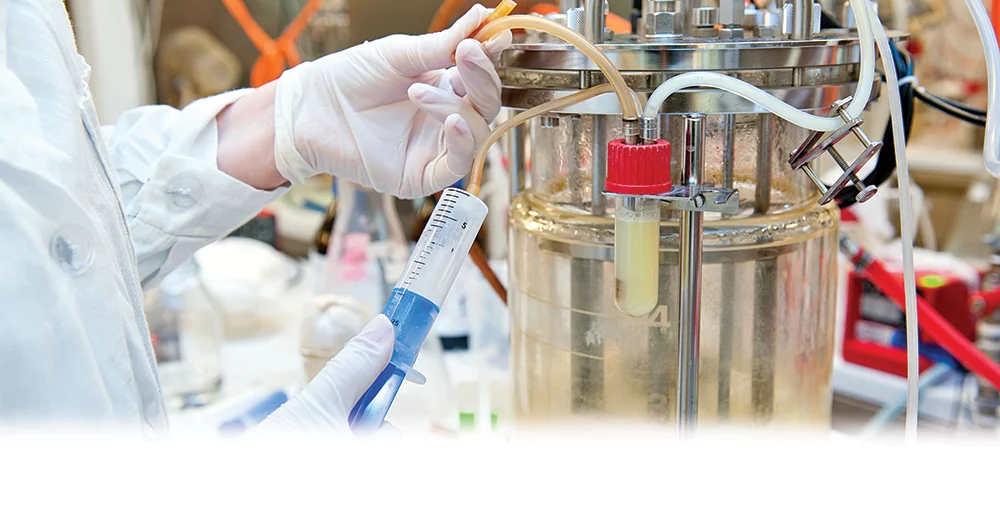
Biomass concentration is defined as the concentration of microbial cells in a culture at a given point in time. Biomass monitoring follows the development of the cell concentration over time and characterizes the growth of the cultivated microorganism.
To describe the development of biomass over time, various parameters (such as backscatter, absorbance, turbidity, optical density (OD), cell dry weight, or cell count) but also synonyms for biomass (like cell density and total cell density or TCD) are used. No matter what it’s called, biomass is one of the most important critical process parameters (CPPs) in microbial upstream bioprocessing.
Interested in the best biomass monitoring technology for your application?
Bioprocessing uses living organisms to convert one or several substrate/s into a desired product. It’s used nearly everywhere today, from the environmentally-friendly production of chemical building blocks to the creation of cutting-edge pharmaceuticals like monoclonal antibodies or cell therapies.
Especially in microbial upstream bioprocessing, where microorganisms such as bacteria, fungi (such as yeast, filamentous organisms), archaea, plants, or algae are cultivated to produce a broad variety of products, biomass is the most commonly monitored bioprocess parameter. In this context it’s mainly applied to suspension cultures, where these microorganisms are grown in microtiter plates, shake flasks, serum bottles, bags, bioreactors, and other cultivation vessels.
In our experience, monitoring these kind of microbial bioprocesses is primarily found in these industrial research areas:
.png)


.png)
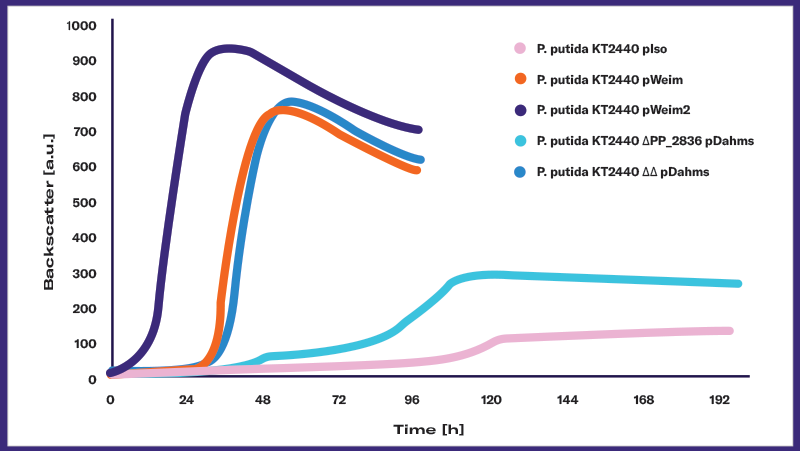
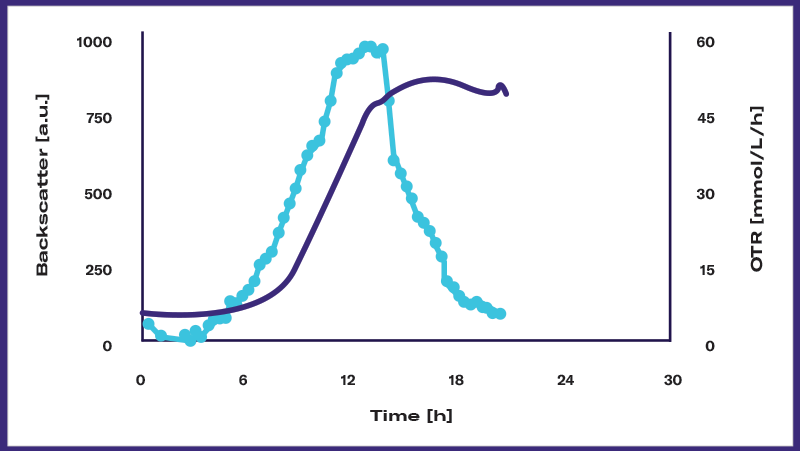
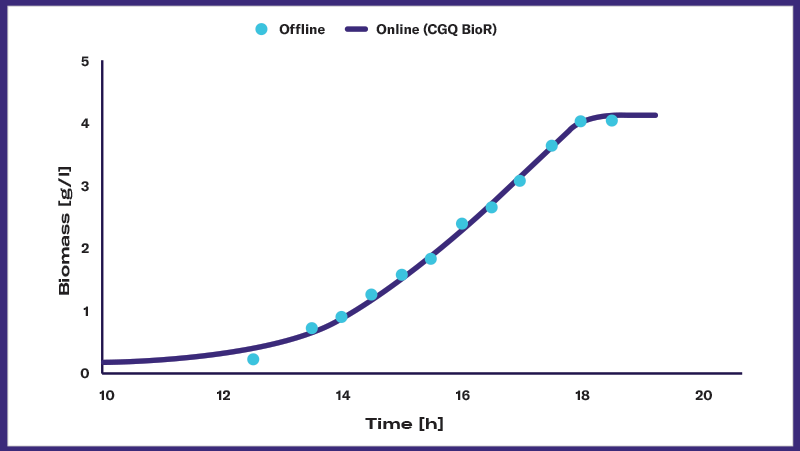
Biomass monitoring is concerned with measuring the biomass in a culture and plotting it over time. The result is an organism- and process-specific growth curve that enables researchers to understand, optimize, and control the bioprocess and — ultimately — the production of the desired product.
-1.png)
Most microbial growth curves can be broken down into six distinctive growth phases:
Lag Phase: The microorganisms adapt to the surrounding conditions like available nutrients, temperature or pH by adjusting their metabolism. In this phase biomass remains constant as there is no growth.
Acceleration Phase: The organisms start to grow and divide, and the biomass slowly increases. In this phase, the growth rate increases.
Log Phase: The organisms are now fully adapted to the surrounding conditions and grow as fast as possible. The biomass increases exponentially. Growth reaches its maximum rate and then remains constant.
Deceleration Phase: When the primary nutrition source is depleted, the microorganisms cannot grow any further. The growth rate drops rapidly and the biomass increase stops. This phase can be followed by adoption to and growth on another nutrient, if available. If not, the culture will enter the next phase.
Stationary Phase: Without further nutrients, the organisms stop growing. The biomass does not increase any further — the growth rate stays at zero.
Death Phase: After a period of starvation, the microorganisms start to die. The biomass will decrease slowly, which results in a negative growth rate.
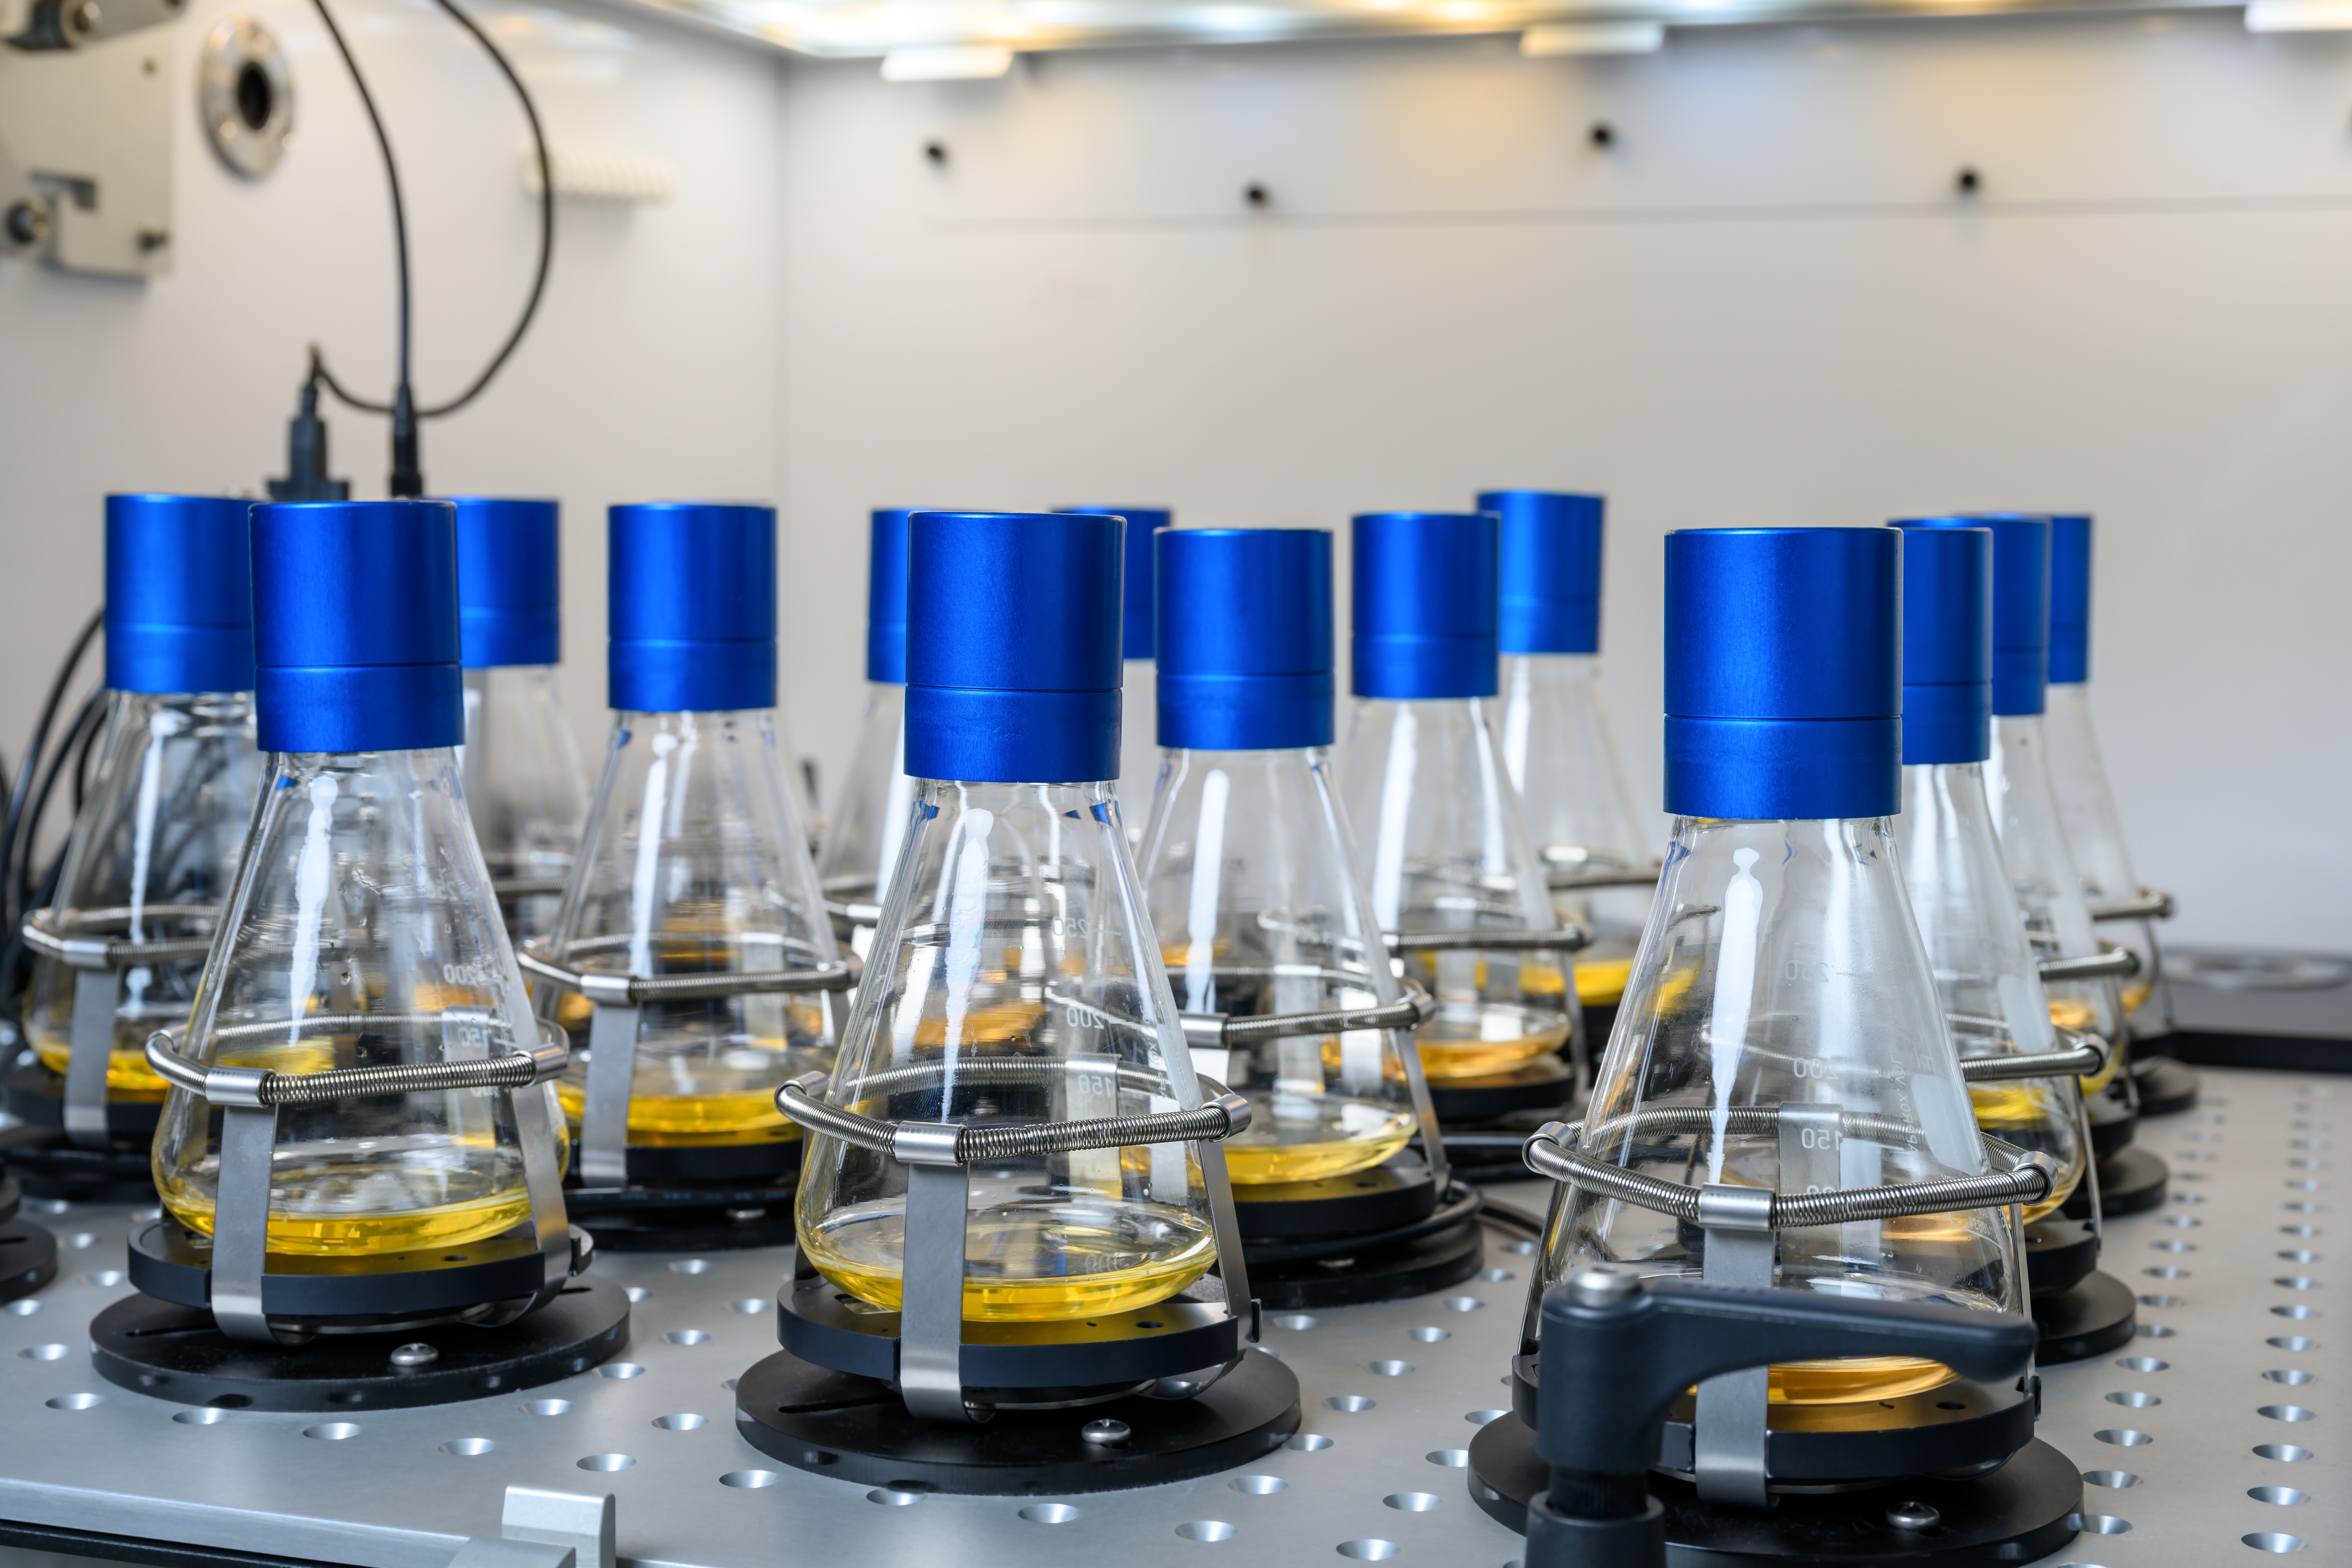
Assuming sufficient data density (number of biomass data points over time) and quality, charting the growth curves and kinetics of microbial cultures is crucial for scientists with a range of tasks and goals, including:
Screening for the best strain and or condition(s): When using microbial strains to create a desired product, scientists are concerned with first finding the right strain to generate it, and then with optimizing the conditions so that strain creates the highest possible concentration of the product. They will want to compare the growth curves of various strains and then of the same strain under various bioprocess conditions (such as temperature, media composition, pH, and batch vs. fed-batch).
Timing experimental workflows: Growth experiments often involve various steps (such as inoculation, induction, feeding, sampling, cell or product harvesting, and cooling) where the scientist needs to manually interact with the process. Knowing or, ideally, seeing which growth phase your organism is in helps with the timing of these manual work steps, and increases experimental efficiency and scientific outcome.
Detecting events: Among the important events that may occur during microbial fermentation are diauxic shifts, oxygen-, substrate, product or metabolite-inhibitions, and morphological changes. It’s crucial for scientists to be able to detect these events in order to characterize and optimize both the microorganism and the bioprocess.
Controlling the quality: Following the growth curve can help determine if an experiment is reproducible or not, and if this cultivation can be used for further experiments or production steps. It can also help scientists detect a problem — and avoid costly problems further downstream.
What can happen if you don’t monitor biomass? The biggest pain points scientists report to us are black-box bioprocesses and being “under-sampled”. Without being able to see what happens in the cultivation vessel, and without data, they have no means to screen or time manual workflows, or ensure quality control — and are at a distinct disadvantage. Monitoring biomass ensures projects run smoothly, stay within budget and deliver the expected results.
-2.png)
.png)
Light with a specific wavelength is emitted into the fermentation broth. A sensor close to the light source detects the amount of the light scattered back by the cells and other particles in the broth. The more cells in the culture, the more light is scattered back.
Used in non-invasive sensors for shake flasks and bioreactors, and in invasive probes for bioreactors.
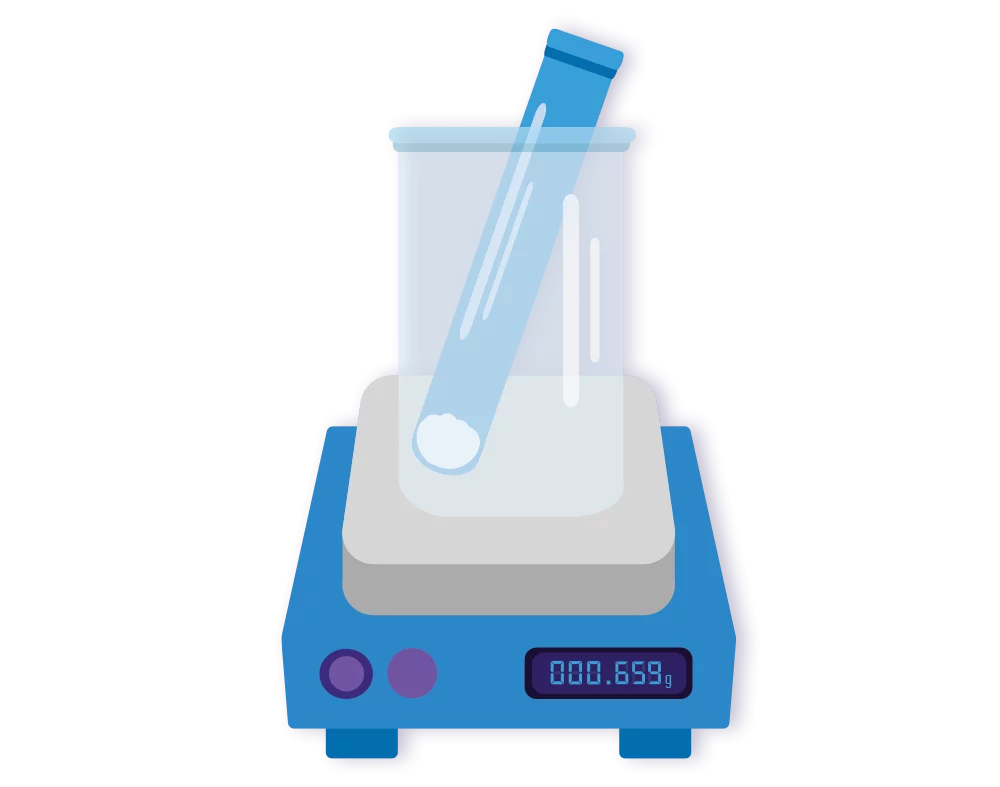
Scientists take a defined volume of cells from the cultivation broth and transfer it into a pre-weighed tube. The cells are then dried overnight so that any water is removed and weighed precisely. Subtracting the weight of the empty tube equals the weight of the dried cells per defined volume.
Offline sampling is combined with measuring the cell dry weight on a fine scale.
-1.png)
Microorganisms have a cell membrane, that, if intact, can act as a capacitor when an electric field is applied. The resulting capacitance can be monitored and used to derive information about the cell concentration and the amount of cells with intact membranes — in other words, viable cells.
Used in invasive probes for bioreactors.
-2.png)
.png)
Light with a specific wavelength is emitted into the fermentation broth. A sensor close to the light source detects the amount of the light scattered back by the cells and other particles in the broth. The more cells in the culture, the more light is scattered back.
Used in non-invasive sensors for shake flasks and bioreactors, and in invasive probes for bioreactors.

Scientists take a defined volume of cells from the cultivation broth and transfer it into a pre-weighed tube. The cells are then dried overnight so that any water is removed and weighed precisely. Subtracting the weight of the empty tube equals the weight of the dried cells per defined volume.
Offline sampling is combined with measuring the cell dry weight on a fine scale.
-1.png)
Microorganisms have a cell membrane, that, if intact, can act as a capacitor when an electric field is applied. The resulting capacitance can be monitored and used to derive information about the cell concentration and the amount of cells with intact membranes — in other words, viable cells.
Used in invasive probes for bioreactors.
Finding the right biomass monitoring technology for your needs can be a challenge. To help, we leveraged nearly a decade of expertise in the field and a network of experts. First, review the 3 key factors you need to consider. Then, tap into our Biomass Monitoring Comparison Guide.
There are 3 key factors to consider when choosing the right biomass monitoring technology for you: your application, your cultivation vessel, and your bioprocess.
Your application is closely linked to what you are actually trying to achieve.
Typical examples we’ve seen among our customers include:
Strain development, screening and characterization.
Bioprocess optimization.
Media optimization.
Growth characterization (including toxicity tests, substrate-/product-inhibitions, and oxygen-limitations).
Timing of workflows (such as inoculation, induction, sampling, feeding, or harvesting).
Product characterization.
Scale up.
Quality control.
-3.png)
The same application will differ from project to project — often because of the bioprocess used. To find the most suitable technology, ask these questions:
How many strains in parallel do we need to monitor?
How much culture volume do we need for product characterization, for instance?
How many resources for manual work steps are available?
How sensitive does the measurement need to be?
Which measurement range do we need to cover?
What level of data resolution do we need?
What organism are we using?
-2.png)
The combination of application and these bioprocess details will lead to your choice of cultivation vessel. In our experience, the most common include:
Titer- or Micro-titer plates (MTPs).
Shake flasks (and serum bottles).
Benchtop bioreactors.
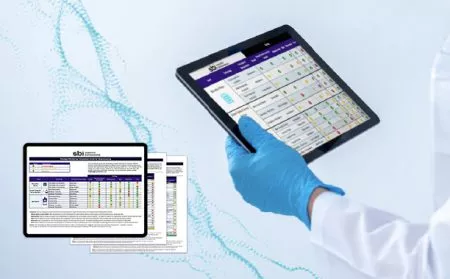
Although most scientists are well aware of these factors, we saw that there was no tool available to compare and decide on the best biomass monitoring technology. We created the first Biomass Monitoring Comparison Guide as a scientist’s comparison tool for the three most common vessel types.
 Score 1
 Score 2
 Score 3
 |
Rating | |||||||
|---|---|---|---|---|---|---|---|---|
| Vessel | Technology | Principle of Measurement | Overall | Manual hands-on-time needed | Measurement | Data | Bioprocess | Cost |
Microtiter Plates |
Plate Reader incl. incubation | Backscatter |  |
 |
 |
 |
 |
 |
| Plate Reader excl. incubation | Absorbance |  |
 |
 |
 |
 |
 |
|
| Plate Reader incl. incubation | Image Analysis |  |
 |
 |
 |
 |
 |
|
Shake Flasks & Serum Bottles |
Non-invasive Sensor | Backscatter |  |
 |
 |
 |
 |
 |
| Sampling + Fine Scale | Cell Dry Weight |  |
 |
 |
 |
 |
 |
|
| Sampling + Photometer | Absorbance |  |
 |
 |
 |
 |
 |
|
Bioreactor |
Non-invasive Sensor | Backscatter |  |
 |
 |
 |
 |
 |
| Invasive Probe | Capacitance |  |
 |
 |
 |
 |
 |
|
| Invasive Probe | Backscatter |  |
 |
 |
 |
 |
 |
|
| Invasive Probe | Absorbance |  |
 |
 |
 |
 |
 |
|
| Sampling + Fine Scale | Cell Dry Weight |  |
 |
 |
 |
 |
 |
|
| Sampling + Photometer | Absorbance |  |
 |
 |
 |
 |
 |
|
| Vessel | Microtiter Plates | ||
| Technology | Plate Reader incl. incubation | Plate Reader excl. incubation | Plate Reader incl. incubation |
| Principle of Measurement | Backscatter | Absorbance | Image Analysis |
| Overall |  |
 |
 |
| Manual hands-on-time needed |  |
 |
 |
| Measurement |  |
 |
 |
| Data |  |
 |
 |
| Bioprocess |  |
 |
 |
| Cost |  |
 |
 |
| Vessel | Shake Flasks & Serum Bottles | ||
| Technology | Non-invasive Sensor | Sampling + Fine Scale | Sampling + Photometer |
| Principle of Measurement | Backscatter | Cell Dry Weight | Absorbance |
| Overall |  |
 |
 |
| Manual hands-on-time needed |  |
 |
 |
| Measurement |  |
 |
 |
| Data |  |
 |
 |
| Bioprocess |  |
 |
 |
| Cost |  |
 |
 |
| Vessel | Bioreactor | |||||
| Technology | Non-invasive Sensor | Invasive Probe | Sampling + Fine Scale | Sampling + Photometer | ||
| Principle of Measurement | Backscatter | Capacitance | Backscatter | Absorbance | Cell Dry Weight | Absorbance |
| Overall |  |
 |
 |
 |
 |
 |
| Manual hands-on-time needed |  |
 |
 |
 |
 |
 |
| Measurement |  |
 |
 |
 |
 |
 |
| Data |  |
 |
 |
 |
 |
 |
| Bioprocess |  |
 |
 |
 |
 |
 |
| Cost |  |
 |
 |
 |
 |
 |
We rated each technology using 20 different criteria, and covering factors such as bioprocess, data and budget. We also evaluated each technology across each type of vessel.
Compare different technologies for each criterium.
Identify the best-fit technology for the category most relevant for your situation.
Compare all existing technologies across each type of vessel.
In the full comparison guide, you can see the definitions of all categories and criteria, incl the individual scores for each technology.
Scientific Bioprocessing (SBI) is dedicated to pioneering Digitally Simplified Bioprocessing. We develop cutting-edge digital technologies (e.g., sensors, actuators and software) that simplify bioprocessing activities from the lab to the production floor.
Our biomass monitoring solutions feature sensors and software that:
Generate high-resolution growth curves in real time to provide you with actionable insights.
Save you hours of manual, hands-on time required for alternative offline approaches.
Enable you to use nights or weekends for growth experiments.
We enable you to simply press “start” in our software — and automatically receive high quality biomass data in real-time that you can trust and use to accelerate your research.
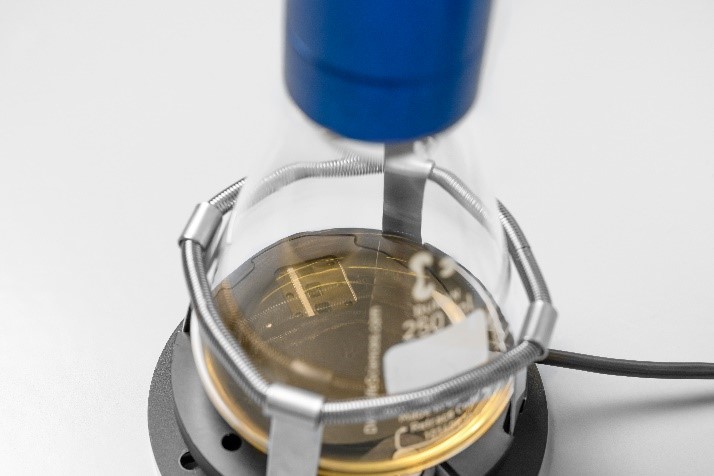
Measure biomass online and non-invasively through the glass wall of the flask.
Monitor up to 64 flasks in parallel.
Compatible with:
A broad range of microorganisms (such as bacteria, yeast, anaerobics, and thermophile or filamentous organisms).
All shake flask sizes (100 mL – 5000 mL).
All incubation shakers (clamps and sticky mats).
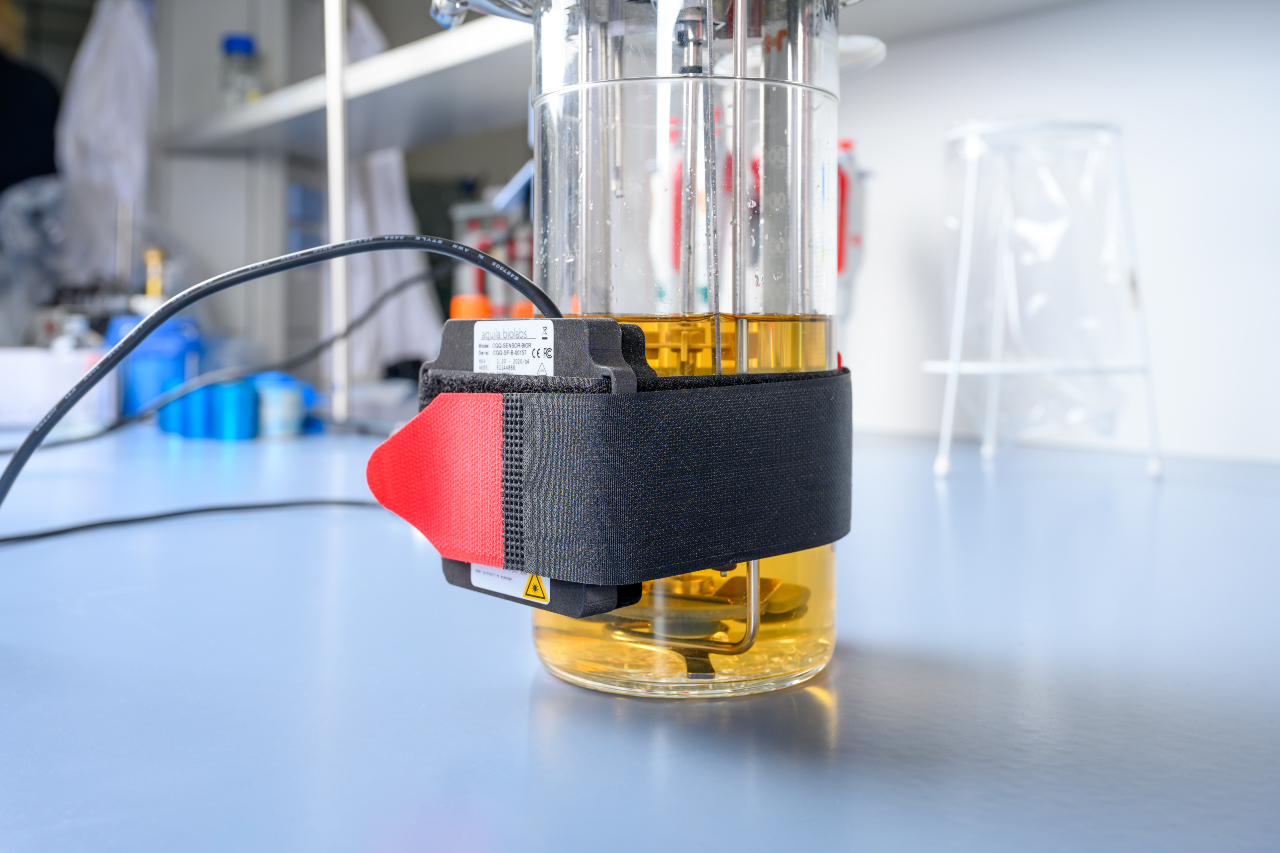
Measure biomass online and non-invasively through the glass wall of the bioreactor.
Two measurement modes for high and low biomass concentrations.
Compatible with:
A broad variety of microorganisms (such as bacteria, yeast, anaerobic, thermophile, or filamentous organisms).
All bioreactor types (single- and double-jacket) sizes.
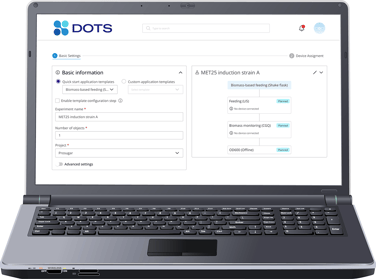
Powerful software for easy sensor handling and real-time data visualization.

-Jun-24-2022-04-22-50-96-AM.png)
-3.png)
.png)
