Data Spotlight
Optimizing Automated Protein Expression in E. coli with DO-Based Smart Feeding: The Role of the MPS and the LIS in Achieving Cost-Effective and Scalable Induction Conditions
Background
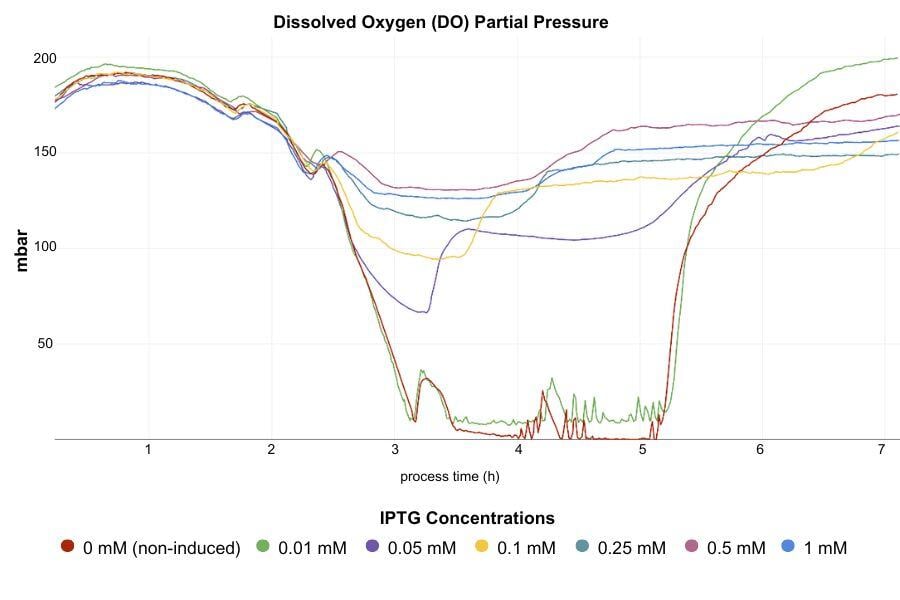
This study focused on optimizing induction conditions for mCherry-tagged protein expression using a novel, automated DO-based "Smart Feeding" induction approach. By using dissolved oxygen (DO) as a metabolic marker, the Smart Feeding induction method enabled precise, automated inductions at critical growth stages. This approach helped in balancing IPTG concentration and DO levels to maintain efficient protein production without compromising cell density or incurring excess costs.
The study objectives were to:
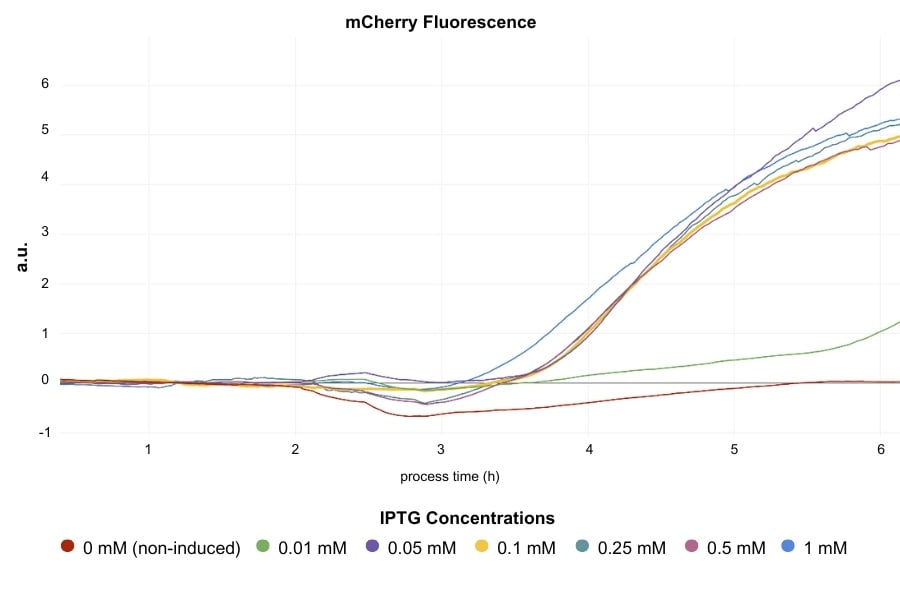
- Characterize fluorescence mCherry-tagged protein expression and DO profiles across a range of IPTG concentrations.
- Test the efficacy of the automated Smart Feeding induction for reproducible, scalable outcomes.
- Find a balance between biomass yield and protein yield per cell by fine tuning IPTG levels and induction timing.
The findings offer insights into optimal induction strategies, which can improve resource efficiency in protein expression systems, making it scalable for larger bioprocessing applications.
Results


Materials & Methods
- Experimental Setup and Conditions:
-
- Cultures were grown in 250 mL Erlenmeyer flask with 10% filling volume, shaken at 250 rpm and 37°C, and shaker door darkened to prevent ambient light interference.
- Inoculation density was set to OD600 of 0.1 from an actively growing preculture to ensure consistent growth.
- Strain and Genetic Constructs:
-
- The study used coli Lemo (DE3) expressing mCherry-tagged protein, with the construct provided by the institute for Molecular Biotechnology, RWTH Aachen University.
- Role of MPS and LIS:
-
- MPS (Multiparameter Sensor): The MPS monitored DO and fluorescence in real-time. In this study, DO was chosen as a measure of increasing cell density due to its reliability because, at the low cell densities typically present during induction, the DO-based trigger was more reliable than manual biomass measurement-based trigger.
Therefore, a threshold of 160 mbar DO was set, and as soon as the DO level dropped below this point, IPTG induction was triggered, ensuring initiation at the optimal growth phase and balancing cell growth with protein expression.
-
- LIS (Liquid Injection System): LIS automatically added IPTG based on MPS-detected DO levels, allowing consistent and precise dosing across IPTG concentrations (0 to 1 mM) without manual intervention.
- Induction and Protein Analysis:
-
- Cultures were induced with IPTG at OD600 0.65, about 2 hours after inoculation. LIS triggered IPTG addition at specific DO thresholds (160, 145, and 130 mbar) to test timing effects.
- For protein analysis, samples were collected, lysed, and analyzed for mCherry fluorescence using a TECAN spectrophotometer (450 nm excitation, 610 nm emission), with data normalized to OD and culture volume.
Conclusion
The study identified the following key results:
- Minimum Effective IPTG Concentration:
IPTG concentrations as low as 0.05 mM were sufficient for high protein expression, while levels below this threshold were ineffective. This low concentration is therefore optimal for cost-effective induction without compromising yield per biomass.
- Trade-Offs Between IPTG Concentration and Biomass Yield:
Higher IPTG concentrations reduced the final OD600, showing a trade-off between protein yield per cell and total biomass. While fluorescence per OD increased with IPTG concentration, higher concentrations above 0.5 mM did not provide further benefits, highlighting the unnecessary cost of excessive IPTG usage.
- Effectiveness of MPS and LIS in Automated Induction:
The DO-based Smart Feeding enabled by MPS (Multiparameter sensor) and LIS (Liquid injection system) allowed for automated, reproducible induction timing, with DO trends providing real-time feedback on culture health and readiness for induction. Early inductions maintained high protein production rates, while delayed inductions allowed more biomass accumulation. The combination of MPS and LIS made it possible to identify a 0.05 mM IPTG concentration with a 160 mbar DO threshold as the most balanced induction condition.
Reference
Louisa Kauth (2022): Development and establishment of photoswitchable systems on the surface of plant virus particles. PhD Thesis, RWTH Aachen University, Germany, https://doi.org/10.18154/RWTH-2022-09870 . Construct pETDuet-Zdk1-G4S-mCherry-his6 was kindly provided by the Institute for Molecular Biotechnology, RWTH Aachen University, Germany
Have questions about your application?
Let’s work together to find a solution that works best for you.
From Estimation To High-Resolution Growth Curves


Customer Success Stories
.png)
-Kitana Manivone Kaiphanliam (Washington State University)
