Data Spotlight
Biomass Monitoring of E. coli in Baffled vs Non-baffled Shake Flasks
Background
Oxygen plays a crucial role in biomass growth, particularly for aerobic organisms. When looking to improve the Oxygen Transfer Rate (OTR) within a cultivation, many often turn to using baffled shake flasks. These flasks are designed with indentations along the interior of the vessel which disrupt the circular swirling pattern of the liquid inside. This increases splashing and in turn, increases aeration. With an influx of oxygen, aerobic organisms may respond by increasing growth and product production.
However, despite this advantage, baffled flasks face their own set of challenges and can cause more harm than good. It is important to understand how baffles can effect one's bioprocess.

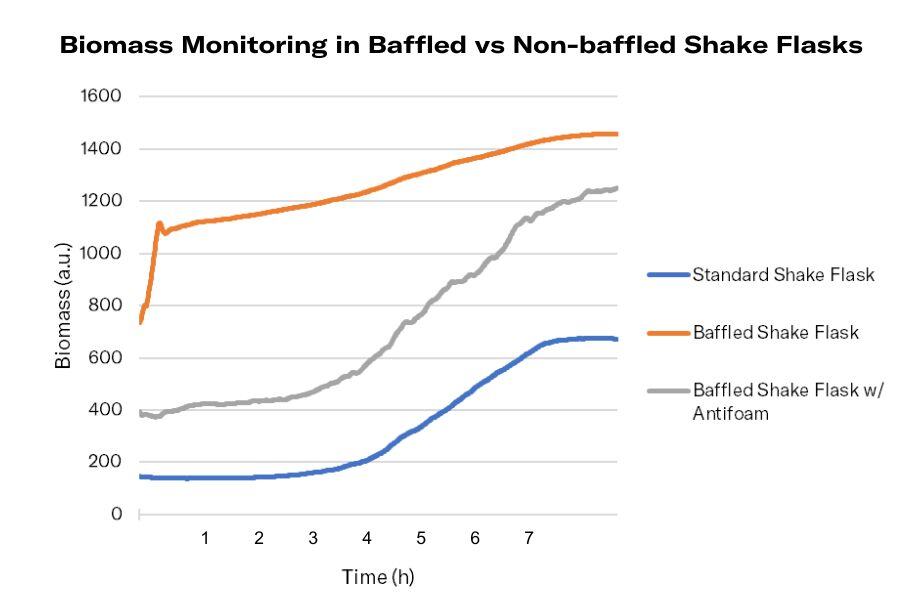
Biomass growth over time in three different types of shake flasks.

Materials & Methods
E.coli cultures were supplied in shake flasks with three different biological settings.
| Culture | Set 1: Standard Setup | Set 2: Baffled (with antifoam) | Set 3: Baffled |
| Filling Volume | 10% | 10% | 10% |
| Additional | + antifoam | ||
| Flask Type | 250 mL, non-baffled | 250 mL, baffled | 250 mL, baffled |
Cultures were grown in LB medium in 250 mL shake flasks and shaken at 37°C and 250 rpm. Biomass was monitored using the Cell Growth Quantifier (CGQ). All cultures were started and stopped at the same time and the shaker was not opened or stopped during the cultivation.
Conclusion
While all three sets show an upward trend in biomass, there were significant differences observed depending on the culture conditions.
Set 1: The first set, used to illustrate the standard shake flask set up, shows a standard growth curve.
Set 2: There was no foam produced in this culture due to the addition of antifoam. The second set shows a similar biomass curve but with significantly higher overall backscatter values and the data is much noisier when compared to the standard conditions.
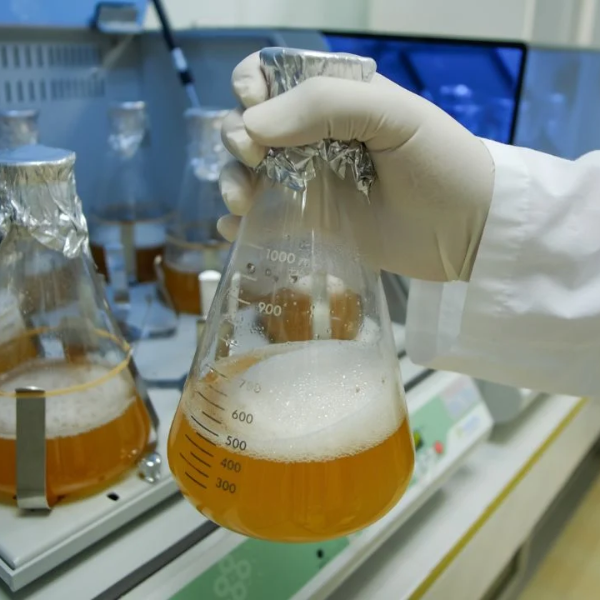
Set 3: In the third set, it was observed that the introduction of baffles resulted in immediate foaming of the culture. Backscatter instantly shows very high baseline levels, comparable to finished culture growth values in non-baffled flasks. No standard growth curve was observed in this culture.
Takeaway: One might assume that the Set 3 (orange curve) is better because the curve is higher. However, online optical measurements measure active particles (including bubbles and foam), thus, the readings are higher compared to non-foaming processes despite not having more biomass in the flask.
While baffles may indeed increase the aeration of one's culture, and thus increase biomass growth, it is important to understand the impact baffles have on your fermentation. Due to the manufacturing process, baffle shapes and sizes between two shake flasks are often varied. These difference and the inherently turbulent nature of baffles can make it difficult to achieve consistent and repeatable results. Additionally, the increase in liquid agitation can result in foam formation, a phenomenon known to have potentially harmful effects on the growth of cells as it actually can impede oxygen transfer.
Online data monitoring can be influenced by this turbulent movement and resulting foam, so some working in baffled shake flasks turn to manual sampling methods when looking to monitor culture parameters, such as biomass growth. However, manual sampling-based data is often not sufficient to fully understand the bioprocess. Offline sampling is complex and time consuming, resulting in lower measurement frequency. This means that critical information from your growth phases are being overlooked, and could have a detrimental impact on your final product. While online measurement systems can be used with baffled shake flasks, baffles are often not recommended as they may interfere with your data.
To learn more about the advantages and disadvantages of baffled shake flasks, check out our blog!
Want Results Like These?
We will work with you on a solution that works best for your application.
From Estimation To High-Resolution Growth Curves


Customer Success Stories
.png)
-Kitana Manivone Kaiphanliam (Washington State University)

.jpg?width=2048&height=300&name=Baffled%20Versus%20Non-baffled%20Shake%20Flasks%20What%20You%20Need%20To%20Know%20(1).jpg)