Join us for the VAAM Industry-Academia Panel (a free online lecture series) on July 11 @ 4pm! REGISTER NOW!

Data Spotlight

Optimizing Sampling Strategies: Selecting Precise Sampling Times of S. cerevisiae in Octanoic Acid Production with the Cell Growth Quantifier

Background

In this study, a Saccharomyces cerevisiae strain was genetically engineered to produce octanoic acid, a medium-chain fatty acid widely utilized as a platform chemical. This biotechnological approach represents a sustainable alternative to traditional production methods. However, further optimization is required to enhance yield.

To address this challenge, researchers aimed to deepen our understanding of the physiological changes occurring in yeast cells during octanoic acid production. To achieve this, they conducted a comparative analysis of the RNA profiles of the production strain and a non-production strain, both cultivated under identical conditions.

Of particular importance was the distinction between three distinct growth phases, as octanoic acid production was observed to occur during specific phases of growth. Leveraging the Cell Growth Quantifier (CGQ), the researchers generated a comprehensive growth profile. These high-resolution growth curves not only provided insights into cellular physiological behavior, as reflected in the growth pattern of the cells, but also facilitated the selection of precise sampling time points: early exponential phase, post-diauxic shift, and during the ethanol consumption phase when growth rate decreased.

baumann - octanoic acid producer

Growth profiles of an S. cerevisiae octanoic acid production strain and a reference strain were monitored in triplicate using the Cell Growth Quantifier (CGQ). These distinct growth curves facilitated the detection of various growth phases, enabling the optimization of sampling times based on the strains' physiological behavior.

Sampling time points were: T1: Early exponential growth phase (after 14h), T2: Shortly after the diauxic shift (22h) , and T3: Ethanol consumption phase (46h).

www.scientificbio.comhubfsPictures 2023Pictures CGQcgq_sticky-mat-2

Materials & Methods

Triplicate cultures of the strains were inoculated from preculture material to achieve an OD600 of 0.1 in 50 mL buffered YPD medium within 300 mL shake flasks. These shake flasks were then placed on the Cell Growth Quantifier for non-invasive biomass monitoring and incubated at 30°C with agitation at 180 rpm. At designated time points (T1: 14 hours, T2: 22 hours, and T3: 46 hours), samples were extracted from the shake flasks. Octanoic acid yield was quantified for each sample, and RNA extraction was performed to investigate the regulation of genes specific to octanoic acid production in the strains.

Conclusion

Through a comparative analysis of growth, fatty acid composition, and gene expression profiles between the producer and a reference strain, this study unveiled profound insights into transcriptomic changes during octanoic acid production. Central to this investigation was the methodical selection of sampling time points, recognizing the distinct metabolic transitions across different growth phases intricately linked to octanoic acid production. Leveraging the CGQ, precise time points were identified based on growth dynamics, eliminating the guesswork associated with blindly sampling at estimated fermentation intervals. Additionally, comprehensive growth profiles were obtained, revealing observable metabolic events such as the diauxic shift. This enabled the authors to correlate shifts in S. cerevisiae metabolism from glucose to ethanol consumption with their observations on octanoic acid yields, further enriching their understanding of the production process.

Source

Baumann et al., 2021. Transcriptomic response of Saccharomyces cerevisiae to octanoic acid production. FEMS Yeast Res. DOI: 10.1093/femsyr/foab011


Want Results Like These?

We will work with you on a solution that works best for your application.

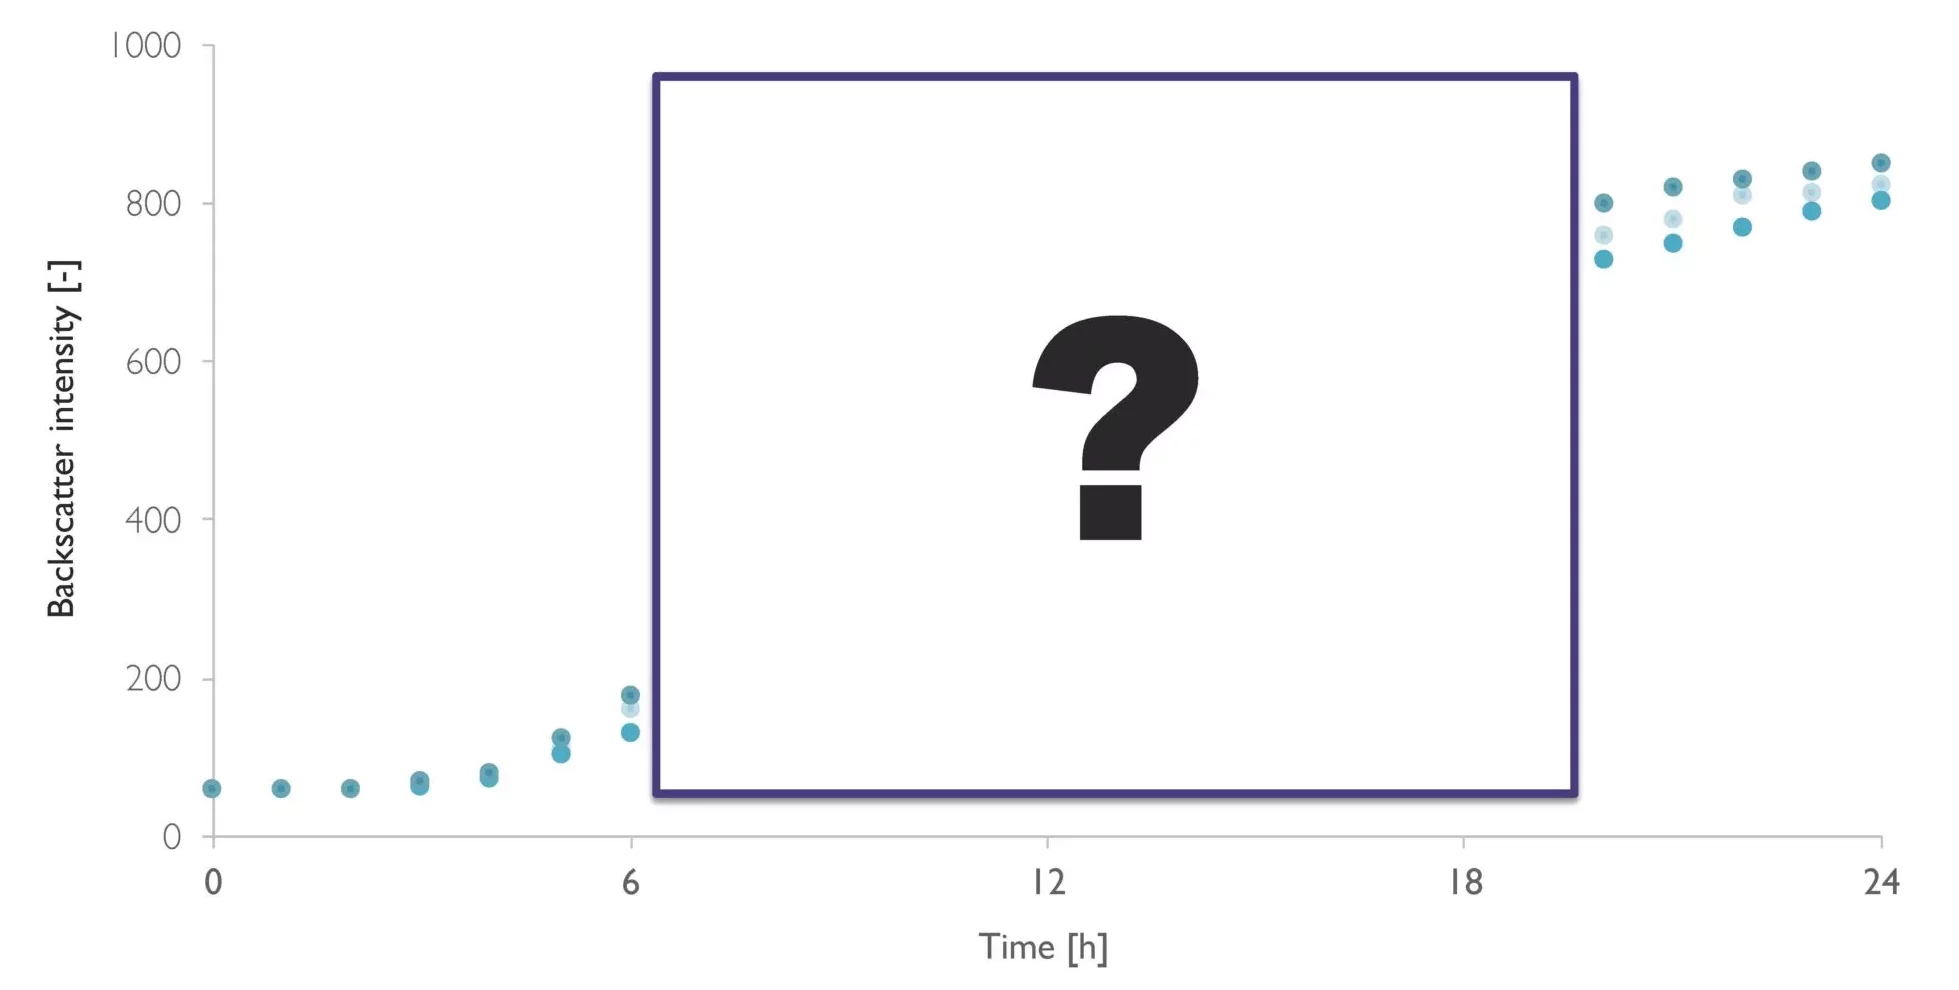
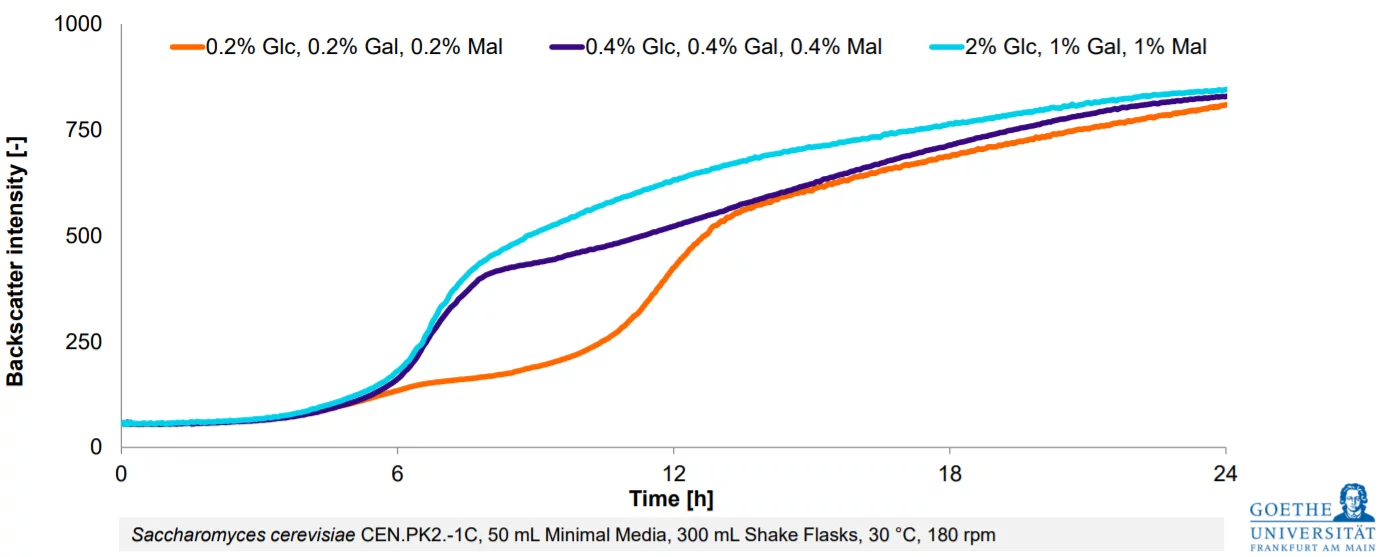
From Estimation To High-Resolution Growth Curves

Cell Growth Quantifier (CGQ)
Success Growth Graph

Customer Success Stories

image (2)
“Incorporating SBI’s pH and DO flow cells into our system removed the need for manual sampling, saving us time, reducing the risk of contamination, and providing information on how the cells are growing even when we are not in the lab. With availability of this more detailed view of our culture, we can make informed improvements to our cell expansion process.”

-Kitana Manivone Kaiphanliam (Washington State University)
washington_state_university_logo