Customer Success Story
Using The CGQ For Monitoring The Effect Of sRNA Regulator Overexpression
Dr. Andrea Sass (Laboratory of Pharmaceutical Microbiology, Ghent University, Belgium)
Background
Small non-coding RNAs (sRNAs) can act as regulatory elements by interacting with mRNA of their targets and influence their expression. Burkholderia cenocepacia, an intrinsically antibiotic resistant opportunistic pathogen able to colonize the lungs of cystic fibrosis patients, expresses numerous sRNAs, but their function is yet unknown. One method to investigate sRNA function is by expressing them in trans from a vector and interpreting the resulting phenotypic changes.
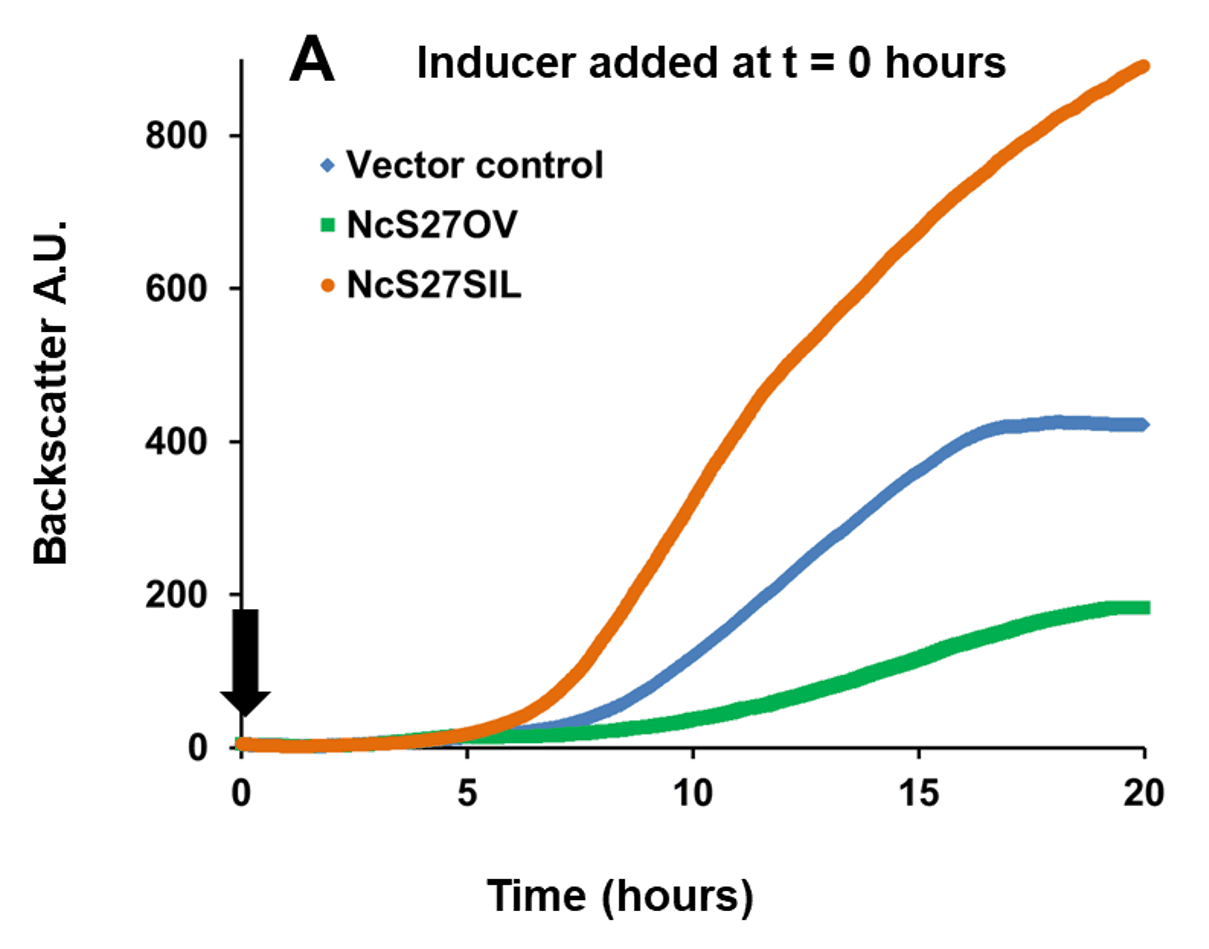
In the example below, a broad host range vector was used, in which sRNA NcS27 or its reverse complement were placed under the control of a rhamnose-inducible promoter. This setup allowed to either overexpress native NcS27, which attenuated growth, or silence it, which enhanced growth (Figure 1, Panel A). To analyze transcriptome and proteome changes associated with in trans expression of sRNAs, the cultures were first grown without the inducer rhamnose. The inducer was then added at a fixed cell
density and the cells harvested after a short incubation time (“pulse expression”, Figure1, panel B). This allowed to measure gene expression changes directly after the initiation of sRNA overexpression, and thereby limit secondary effects associated with a change in growth rate.
 Fig. 1 Growth of Burkholderia cenocepacia NcS27 overexpression and silencing mutants. Black arrows indicate the timepoint of inducer addition (0.2% w/v rhamnose). Panel A: Inducing expression from the vector at time of inoculation resulted in a marked growth attenuation in the overexpression mutant (NcS27OV, green) compared to vector control (blue). Growth of the silencing mutant (NcS27SIL, orange) was enhanced compared to vector control. Panel B: Without inducer, all three strains grow to the same extent; adding the inducer triggered the same phenotypic changes as shown in panel A. Y-axis: Backscatter arbitrary units (A.U.), off-set to zero at time = 0. Growth tests performed in phosphate buffered medium with yeast extract (5 g/L), casamino acids (2 g/L), glycerol (5 g/L) and trimethoprim (800 µg/ml).

Testimonial
“The CGQ made it possible for us to observe growth dynamics in real time in a larger culture volume, the same volume necessary for harvesting cell material for downstream analyses such as RNA-Seq, proteomics or enzyme activity measurements. It allowed us to choose the optimum time points for adding inducers and for harvesting, at a precise cell density, and without having to remove samples for optical density measurements. This has very much improved performance and reproducibility of our experiments, and it has increased our throughput considerably. The setup for our experiments was custom made for our lab, and aquila biolabs was always at hand to help us adapting the system to our needs“
Dr. Andrea Sass (Universiteit Gent)