Data Spotlight
Real-Time Monitoring of the Photoswitching of DsRed1-E5 Fluorescent Timer: Distinguishing Between Recently Synthesized and Matured Protein
Background
In this study, a pTimer vector was used encoding the DsRed1-E5 mutant red fluorescent protein. The peculiar characteristic of this protein is its predictable color shift - also called photoswitch - over time. Initially, upon expression, DsRed1-E5 emits bright green light (with an emission maxima at 500 nm). However, as time progresses, the green fluorophore undergoes modifications leading to a shift in fluorescence towards longer wavelengths. Upon full maturation, the protein emits bright red light (with an emission maxima at 583 nm).
Consequently, this protein serves as a valuable tool for monitoring transcription from various promoters integrated within the pTimer vector. It facilitates easy testing and comparison of promoter activities. Furthermore, it enables investigation into the effects of different enhancers (agents stimulating promoter activity) or induction strategies on protein expression. For instance, one could explore the impact of varying methanol concentrations on activating the methanol-dependent promoter in Pichia pastoris, and optimize induction strategies accordingly.
In this study, the protein was expressed in E. coli and the Multiparameter Sensor (MPS) was employed to measure fluorescence at different wavelengths in real-time.

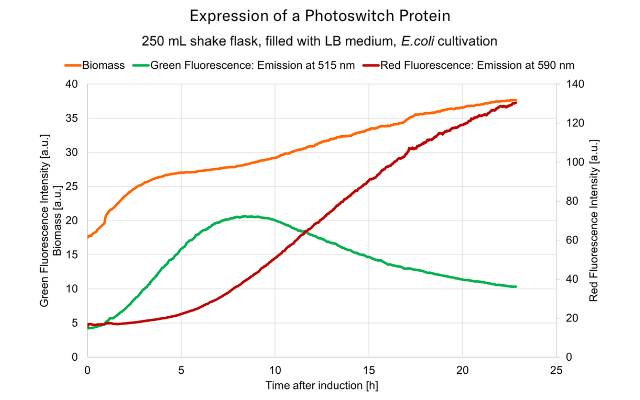
Fluorescence intensities at two distinct wavelengths (green: 515 nm, red: 590 nm) measured online with the Multiparameter Sensor (MPS). Real-time data illustrates the expression profile of the red fluorescent protein mutant DsRed1-E5 after induction with IPTG, demonstrating a peak expression around 8 hours after induction. Biomass (orange graph) was monitored additionally by the MPS to track growth of the E.coli culture.
Green fluorescence reflects the level of newly synthesized protein, while red fluorescence corresponds to the accumulation of matured protein.

Materials & Methods
Escherichia coli cells were transformed with the pTimer vector, encoding the DsRed1-E5 mutant red fluorescent protein under control of the lac promotor. A 250 mL shake flask was used for cultivation, filled with 20 mL of LB medium and innoculated with recombinant E.coli cells. After 4 hours, 1 mM Isopropyl-β-D-thiogalactopyranosid (IPTG) was added to induce the synthesis of the DsRed1-E5 protein.
The cultivation was monitored with one Multiparameter Sensor (MPS) which simultaneously monitored biomass (backscatter units, a.u.), green fluorescence intensity at an emission of 515 nm and red fluorescence intensity at 590 nm emission. Real-time data was visualized and processed with the DOTS Software.
Conclusion
The DsRed1-E5 protein serves as a versatile fluorescent timer, facilitating the analysis of promoter activity during fermentations, enabling the observation of both activation and downregulation of target promoters. Green fluorescence indicates recent activation and red fluorescence represents areas where promoter activity has ceased after an extended 'on' period.
With the DOTS Multiparameter Sensor, fluorescent changes throughout the cultivation can be monitored in real-time, eliminating the need for sample drawing. Together, these technologies (pTimer and MPS) streamline online promoter activity tracking with maximum ease and efficiency. Real-time data acquisition allows for timely interventions, such as recognizing low promoter activity and implementing additional inductions to maintain a constant level of activity.
Source
Further reading on the DsRed1-E5 fluorescent protein:
Terskikh A., et al., 2000. "Fluorescent timer": Protein that changes color with time. Science. https:// doi.org.10.1126/science.290.5496.1585
Interested in real-time fluorescence monitoring in shake flasks? Check out this Application Page!
Want Results Like These?
We will work with you on a solution that works best for your application.
From Estimation To High-Resolution Growth Curves


Customer Success Stories
.png)
-Kitana Manivone Kaiphanliam (Washington State University)
